Visualize Your Smart Contract Code!

Smart contracts are the new game-changer in the internet world!
They are the driving force behind all things Web 3.0, whether it is the newest innovation in the DeFi world, a platform for trading NFTs or a newly formed DAO working tirelessly to change the world. Often, one of the biggest challenges smart contract developers face is that as projects grow in size, keeping track of all the different connections between the multiple contracts can become somewhat of a hassle.
Have you been facing the same issue with your projects?
If so, then fret not, for there is a solution. In fact, there are many. Let's take a look at some of them here.
Smart Contract Visualization Tools
There are multiple visualization tools out there that can be used by developers to gain a better understanding of how their smart contracts work. These tools are even used by auditors, who protect and provide security to our smart contracts, to gain deeper insights into the contracts and weed out potential bugs within them.
Let's take a look at some of them here.
Solgraph
Solgraph is a popular Solidity visualization tool that creates a DOT graph showing the control flow for all the functions in your project, thereby allowing you to get a visual representation of the entire project.
What's DOT, you ask?
Well, DOT is a graph description language that can be used to describe both kinds of graphs, directed as well as undirected. We'll see how these work, in a moment.
You can find the repository here.
Solgraph Requirements
- nodeJs
- npm (Node package Manager)
How to install Solgraph?
You can install Solgraph using npm:
npm install -g solgraphSolgraph Usage:
solgraph contract.sol > graph.dot
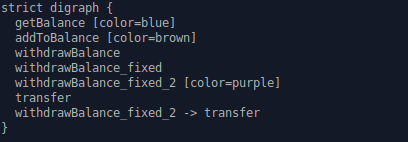
The DOT file generated looks something like this:
At this point, you're probably thinking - "Hey, this was supposed to be a VISUAL representation? Where are my graphs?"
If so, then worry not. Let's see how we can convert this text into a visual representation.
For that, you'll need to have Graphviz installed.
Use
sudo apt-get install graphviz
for linux or
brew install graphvizfor Mac
Once you have that installed, you can run the following command to generate a graph from the given DOT file:
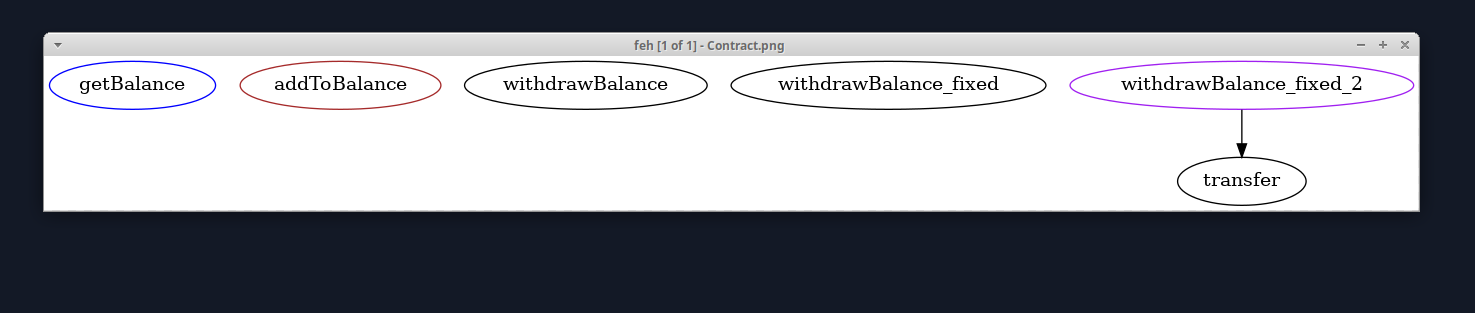
dot -Tpng Contract.dot -o Contract.pngThis will result in a PNG file containing a graph of the smart contract's flow. You can use any image viewer to analyze the graph, which looks something like this:
Surya
The developers of Surya describe the tool as a "utility system" for smart contracts. It gives you more details about your smart contracts and allows you to generate a complete holistic overview of your Solidity projects.
You can find the tool repository here.
Surya Requirements
- nodeJs
- npm (Node package Manager)
How to install Surya
You can install surya using npm:
npm install -g suryaSurya Usage:
You can use the graph command to generate the control flow graph. Once again, you'll need to have graphviz installed in order to generate a visual graph from the DOT file.
surya graph contracts/*.sol | dot -Tpng > Graph.pngThe result is something like this:
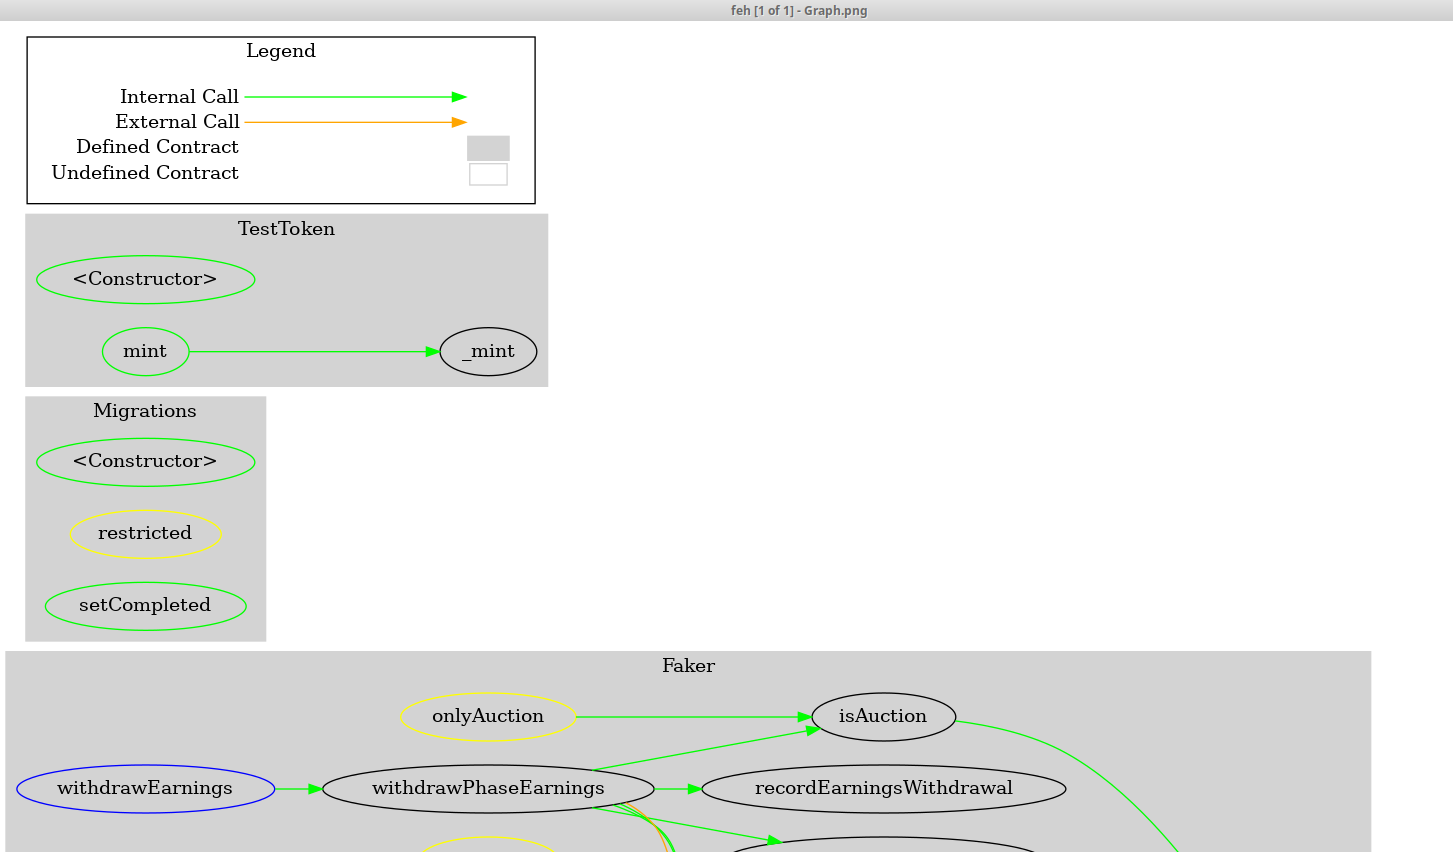
As you can see, Surya gives you a much more detailed overview as opposed to Solgraph.
There are other tools for this as well, but I've found these two to be the most useful as part of my process.
Worried about attackers targeting your smart contracts? Contact DeTaSECURE today for all your smart contract audit needs!